Supplementary Material for the ISMB 2005 paper
|
RASE: Recognition of Alternatively Spliced Exons in C.
elegans
|
|
The abstract and paper is available from the bioinformatics site.
This page contains additional material to the
above mentioned paper. We tried to document exactly
- how the different data sets were generated (and make them
available for download),
- what results where achieved in:
- the cross-validation procedure for the "Could this exon be
excluded in the geneproduct ?" predictor as well as
- in the wetlab validation on this task.
- model selection for the "Is there an alternative exon within
this given intron and where ?" predictor
- how the methods perform on all available ESTs of
C.elegans and
- which features were most valuable in SVM-training.
In Section 1 we provide the datasets used
for learning splice sites, the dataset for alternatively spliced
exons and the splits used for its training. Extensive model
selection results are shown in Section 2. More
details about the wetlab experiments including e.g. sequencing
primers and gel images are given in Section 3,
followed by an interpretation of the trained SVM using multiple
kernel learning in Section 4. There the most
significant k-mers as well as kernel weights and penalty functions
are presented. In the last Section a list of
alternative exons as predicted by our methods is displayed.
|
-
Splice database
We collected all known C. elegans ESTs from Wormbase (release WS118;
236,868 sequences), dbEST (as of February
22, 2004; 231,096 sequences) and UniGene
(as of October 15, 2003; 91,480 sequences). Using blat we aligned
them against the genomic DNA (release WS118).
The alignment was used to confirm exons and introns. We refined the
alignment by correcting typical sequencing errors, for instance by
removing minor insertions and deletions. If an intron did not
exhibit the consensus GT/AG or
GC/AG at the 5' and 3' ends, then we tried to
achieve this by shifting the boundaries up to 2 nucleotides (nt).
If this still did not lead to the consensus, then we split the
sequence into two parts and considered each subsequence separately.
For each sequence we determined the longest open reading frame
(ORF) and only used the part of each sequence within the ORF. In a
next step we merged alignments, if they did not disagree and shared
at least one complete exon. This lead to a set of 135,239 unique
EST-based sequences.
We repeated the above procedure with all known cDNAs from
Wormbase (release WS118; 4,848 sequences) and UniGene (as of
October 15, 2003; 1,231 sequences), which lead to 4,979 unique
sequences. We removed all EST matches fully contained in the cDNA
matches, leaving 109,693 EST-base sequences.
Finally we obtained the following splice dataset:
Download splice.tar.gz
-
Alternatively Spliced Exons database
We collected all known C. elegans ESTs and cDNAs from
Wormbase (release WS135), dbEST(as of December 17, 2004) and
UniGene (as of December 17, 2004). We merged the data bases and
removed duplicate EST sequences (either orientation). Using
blat we aligned them against the genomic DNA (release
WS135). We only considered sequences with at least 90% sequence
identity (over the full length of the sequence). We refined the
alignment by correcting typical sequencing errors and by handling
polycistronic sequences (see supplementary website for more
details). The alignment was used to confirm exons and introns.
Finally we merged the alignments, if they did not disagree and
shared at least one complete exon or intron. For each determined
exon and intron we counted how often they were confirmed by
(unique) ESTs.
In the following step we identified pairs of sequences in our
set that share the same 3' and 5' boundaries of the upstream and
downstream exon, respectively, where one sequence contains an
internal exon and the other does not (i.e. shows evidence of
alternative exon usage with the same flanking exon boundaries).
This way we identified 487 exons for which ESTs show evidence for
alternative splicing. As negative examples we only considered exon
triples that did not show evidence for alternative splicing and the
internal exon and the flanking introns were at least two times
confirmed by an EST sequence. We were able to extract 2,531 exon
triples with the internal exon likely to be consitutively spliced.
This data base of in total 3,018 examples is used for training,
model selection and evaluation of our methods.
Finally we obtained the following alternatively spliced exon
dataset:
Download altsplicedexons.tar.gz
- Dataset splits Here the dataset splits as used in the
crossvalidation procedure in are provided:
Download altsplicedexonsplits.tar.gz
|
- Alternative Exons (Skipped in one Spliceform)
| The following model parameters were tuned in crossvalidation:
SVM-C (0.5, 1, 2), sigma (1/L, 0.1/L), kappa (0, 0.05, 0.07, 0.1,
0.14, 0.19, 0.26, 0.37, 0.51, 0.72, 1) and d (10,15,33). The
optimal parameters for each train-test split were chosen such that
they maximize the fp 1% validation score. Parameters as well as
validation and test error are given in the following table. There
fp 0.5% (1%) stands for the percentage of true positives achieved
at a level of 0.5% (1%) false negatives. AUC denotes the area under
the ROC curve. Note when performing model selection based on fp
0.5% or AUC a different parameter sets may be optimal. However the
respective test error is given when model selection was based on
the corresponding validation error. |
|
|
|
|
|
validation score |
test score |
|
C |
sigma |
d |
kappa |
fp 0.5% |
fp 1% |
AUC |
fp 0.5% |
fp 1% |
AUC |
| split1 |
1.00 |
1.00 |
33 |
0.37 |
40.90% |
47.65% |
90.84% |
45.37% |
51.85% |
89.90% |
| split2 |
1.00 |
10.00 |
15 |
0.19 |
39.72% |
45.54% |
89.91% |
48.98% |
60.20% |
92.63% |
| split3 |
0.50 |
10.00 |
10 |
0.72 |
43.25% |
47.15% |
90.06% |
32.26% |
49.46% |
92.88% |
| split4 |
2.00 |
10.00 |
10 |
0.26 |
45.52% |
52.81% |
91.45% |
40.86% |
40.86% |
88.32% |
| split5 |
2.00 |
1.00 |
15 |
1.00 |
46.37% |
52.75% |
91.24% |
33.68% |
40.00% |
88.70% |
|
- Splice site detection
- Potential Alternative Exons hidden in Introns
|
-
Materials and Methods
We considered 21,508 exon triples (only single EST confirmed) for
alternative splicing. For 18 randomly selected cases from the 1%
top ranked predictions, we performed a confirmation experiment. In
11 experiments we obtained at least two PCR products of appropriate
size, while in 5 cases we obtained only one PCR product (see figure
below). In two cases the PCR failed and did not lead to a
measurable product. For the negative control we correctly obtained
only one product and for two of the three positive controls we
obtained two products (PCR failed for the third). For 11 test cases
and the two positive controls we sequenced the different PCR
products and obtained 6 significant sequencing results (including
one for a positive control). Out of the 5 significant test cases
three exhibited alternative exon usage (verified by aligning the
sequences against the genome). Unfortunately, the sequenced
products for the remaining positive control did not show evidence
for alternative splicing although the exon is known to be
alternatively spliced. This indicates that the biological testing
setup is not yet optimal, and that further scrutiny might well
reveal that more of the candidates predicted by our algorithm do
indeed show alternative splicing.
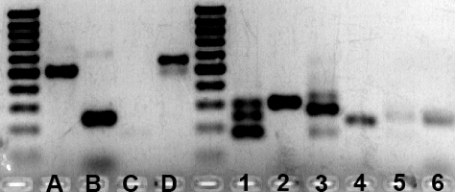
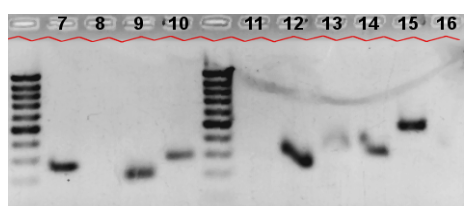
-
Gel Electrophoresis Plot
The gel electrophoresis plot obtained in the wetlab experiment. The
control sequences A, B, C, D (B-D are positive controls) and the
first 6 evaluated sequences are shown in the upper plot, the
remaining 10 are displayed in the lower figure.
- The following table shows the sequence products for the three
correctly predicted alternatively spliced exons. For each item the
number of bands as well as their sequence are shown.
| ID |
products |
product lengths |
sequenced products |
|
| 1 |
3 |
110,130,130 |
ATATGTGCACTGACCACATGGCCTTACACTGGCAACCACGAACACACTCC
ACATCTGNGCGATGTNGTCGAGCTATGCGAGGANGTTTCCCTAGTGGATT
GCGGACA
CCTCCAGTCCGGTCGAGCAGGAATCGATCACAAAGTAGAGCTTCTTGTCC
GCAATCCACATAGGGAAATGTCCTCGCATATGCTCGACGTACATCGCGCA
TCATGTGGAGTGGGNCGTGGTGGCCA
TCCAGTTCCGTCCGAGCATGAATCGATCACAAAGATGTGGAGTGTGTCGT
GGTTGCCAGTGTAAGCCATGTGGTCAGTGCACATATTGTCAGGATTCACC
ACAGTTTGGAGGTCCTGGTGTTAAGAAAAA
|
view at wormbase |
| 3 |
2 |
170,132 |
GATGCGCACATTGCGACGCGTCAAGCGTGCGCCAACCAGAAATAATCGAC
CCGAACCGGCTAGTTTGTGGGTCGCAATGGAACTGGTAAATGCGATGATA
TCCGCATGATCGCGCATCTCATTTTTGCGGAATGGAAGAAGAAGTGTCCG
CACCTCCGATTCCGCCGCCAGATG
ATGCGCACATTGCGACGCGCTCAAGCGTGCGCCAACCAGAATGTCCGCAC
CTCCGTATTCCGCCGCCAGATGAAGGAAAATGCATCATTTCGAAGGCATC
GGGCCGTGAGATTTGCTACCCATCGTACAGTCA
|
view at wormbase |
| 5 |
3-4 |
180,210,140 |
GCACAATTCTCCAGCTGATTTGACTGAGGATCAACGGAATGCATATCTTC
TTCAACTCGAAATTGAGGACGCCACACGGAAACTGCGTCTCGCAGATTTT
GGAGTCGCCGAGGGAAGAGAACGATCTCCATCTCCTGAACCAGTTTACGA
CGCAAATGGTAAGCGGTTGAACACTCGTGAAGTGCG
CACAATTCTACCAGCTGATTTGACTGAGGATCAACGGAATGCATATCTTC
TTCAACTCGAAATTGAGGACGCCACACGGAAACTACGTCTCGCAGATTTT
GGAGTCGCCGAGGGAAGAGAACGATCTCCATCTCCTGAACCAGTTTACGA
CGCAAATGGTAAGCGGTTGAACACTCGTGAAGTGCGGAAACGGCAGGAAT
TGGAACAGTTGAG
CACAATTCTACCAGCTGATTTGACTGAGGATCAACGGAATGCATATCTTC
ATCTCCATCTCCTGAACCAGTTTACGACGCAAATGGTAAGCGGTTGAACA
CTCGTGAAGTGCGGAAACGGCAGGAATTGGAACAGTTGAGA
|
view at wormbase |
- In the following one finds the list of primers used to tag the
exon tripples in the wetlab experiment. The ID is the sequence ID
as in the figure above. Additionally the length of the gene product
including the exon as well as excluding the exon and the exon
length itself are given.
| ID |
rank |
length w/ exon |
length w/o exon |
length of exon |
left primer |
right primer |
gene id |
| A |
neg probe |
499 |
167 |
332 |
CCAGCTACAGAAAGTGAGGGA |
TTATGATCAAGACCAAACCACG |
ZK121.2 |
| B |
pos probe |
239 |
179 |
60 |
ACGGATGTCATCGTCTAGTCA |
GAGTGTTGATTTGCTTCTGCC |
ZK899.8a |
| C |
pos probe |
255 |
177 |
78 |
CTCATGTTAGCTCGCACAGAA |
GCCGTTCTGATTGGATATTGA |
C18B2.5a |
| D |
pos probe |
564 |
176 |
408 |
GGACGCCGAGGAAGGATA |
TGCTCCAGTTGTTTGAGCAC |
H19M22.2a |
| 1 |
6 |
239 |
176 |
63 |
ATCGTCACAAAACAGTCAGGC |
TTCTTAACACCAGGACCTCCA |
Y75B8A.6 |
| 2 |
8 |
302 |
219 |
83 |
AGAAGCTTGCCAAGGAAGTTG |
CGTCTTGCGTATCCACTGAA |
T22B7.1a |
| 3 |
30 |
272 |
173 |
99 |
CGAAGTAGAAAGCCTTGCACA |
TGACTGTACGATGGGTAGCAA |
K07E12.1 |
| 4 |
32 |
234 |
174 |
60 |
ATGAGTTTGACAGCTCCGCTA |
CGTACAGTGCAATGACAAAGTG |
Y16B4A.1 |
| 5 |
52 |
252 |
179 |
73 |
GTCGTTGGTCTACAACAAAAAGT |
CTCAACTGTTCCAATTCCTGC |
Y116A8C.32 |
| 6 |
54 |
226 |
142 |
84 |
CAACAATAAACCTTGAAGAACGA |
TTCTGCGCCTCTCTCATACTC |
F35G2.5 |
| 7 |
74 |
261 |
153 |
108 |
ACATAATTTCCGTCCAAAACG |
TTTGGAGCCGAAGAAAGTGTA |
ZC416.6 |
| 8 |
83 |
305 |
178 |
127 |
AGACAATGACGAGTACGACCG |
AAATACGCATCATAGACATTTCG |
F12F6.3 |
| 9 |
99 |
202 |
146 |
56 |
ATGGCGACAATCAACAGCC |
ATTCTATTCGCTTTTCCGACG |
B0563.4 |
| 10 |
107 |
291 |
159 |
132 |
GACGATTTGGCCTTGGATT |
TCGACGAGAGGTGTCTAGAAGA |
C24A1.2 |
| 11 |
108 |
232 |
151 |
81 |
CACCATGACGAGAAGGTTGAT |
TTGTAGCAGACACCTCTCCAAA |
T06G6.6 |
| 12 |
109 |
235 |
158 |
77 |
CCATCGCCTTGGAGCAAC |
GCTACTTGACACTGGCTGAGG |
W10D9.4 |
| 13 |
121 |
268 |
139 |
129 |
CCGATGAAGTGGAGCTGAAT |
TCTGCTTGCCATTGACTCTTT |
C08B11.3 |
| 14 |
122 |
291 |
155 |
136 |
AAACGGAATCCCGAGCTG |
CGTCTTCCACAATTTGTTTGAT |
Y51A2D.7a |
| 15 |
130 |
467 |
179 |
288 |
CATCAAGGACAAGAAGTGCAAG |
GCAGTGATGATTTTCATGGGT |
R06B9.4 |
| 16 |
134 |
197 |
144 |
53 |
TATGTCGGCTCCCAGAAATC |
TCAAGTGTCCCGTTCAAATTC |
C06G1.% |
|
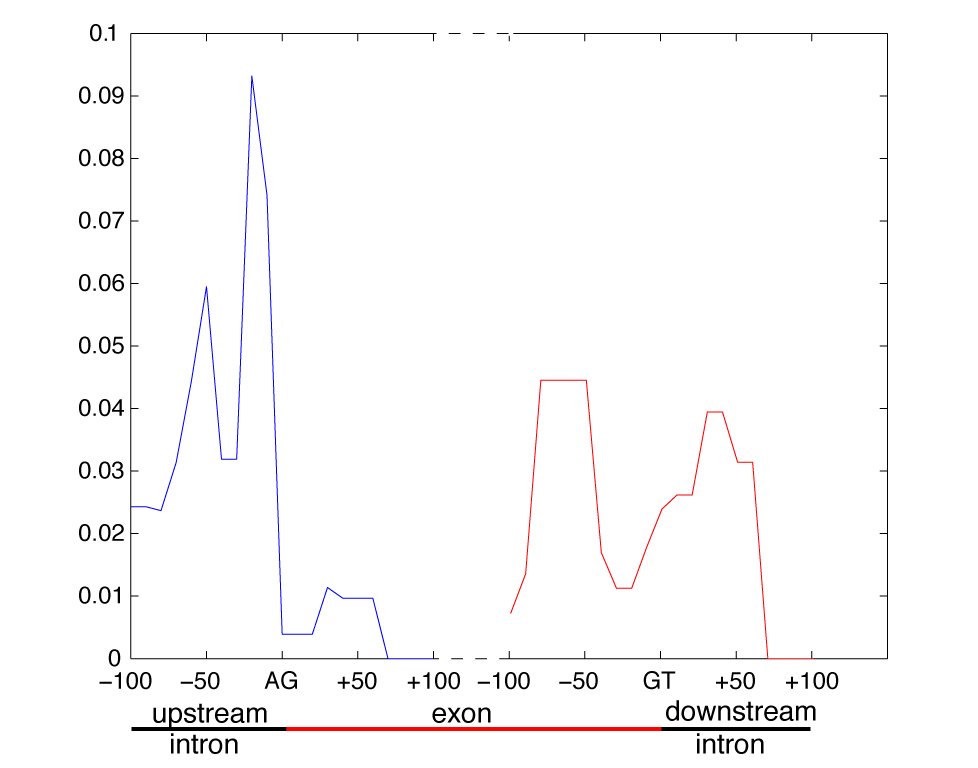
- The following figure displays the kernel weights obtained by
multiple kernel learning. The importance of the k-mers starting at
a certain position in the sequence is shown.
- In the table below the twelve most significant k-mers
(including e-value and counts) for the following parts of the
sequence are shown: intron -70 to -40, intron -30 to 0, exon 30 to
70, exon -90 to -30,intron 0 to 70. K-mmers were extracted within
these region seperately, while those regions were chosen which
obtained a high kernel weight (see mkl plot above).
| intron -70 to -40 |
intron -30 to 0 |
exon 30 to 70 |
exon -90 to -30 |
intron 0 to 70 |
| 6-mmer |
e-value |
# |
| ctaacc |
1.2e-17 |
12 |
| cccccc |
3.8e-11 |
10 |
| taaccc |
9.8e-10 |
9 |
| cacttt |
6.2e-09 |
21 |
| atcccc |
1.6e-07 |
6 |
| ctttcc |
2.4e-07 |
12 |
| ctctat |
3.6e-07 |
9 |
| tcccct |
4.8e-07 |
7 |
| actaac |
5.3e-07 |
11 |
| tctatc |
8.4e-07 |
12 |
| ttctct |
1.1e-06 |
15 |
| gtctat |
4.2e-06 |
8 |
|
| 6-mmer |
e-value |
# |
| cattct |
1.3e-09 |
17 |
| ctctct |
1.9e-09 |
11 |
| gcatgt |
4.4e-09 |
7 |
| gttgtc |
4.4e-09 |
7 |
| tctcta |
2.2e-08 |
15 |
| ctctat |
1.1e-07 |
13 |
| cctatc |
1.6e-07 |
6 |
| tatcgc |
4.8e-07 |
7 |
| cactct |
5.0e-07 |
8 |
| tctaac |
5.3e-07 |
11 |
| tctatc |
5.3e-07 |
11 |
| tgtgta |
5.3e-07 |
11 |
|
| 6-mmer |
e-value |
# |
| agtgag |
4.2e-11 |
18 |
| tttttt |
2.7e-09 |
21 |
| atatat |
1.3e-08 |
17 |
| tatata |
3.6e-07 |
13 |
| ataggt |
4.8e-07 |
7 |
| taggtt |
5.0e-07 |
8 |
| ggtaaa |
8.4e-07 |
12 |
| caccac |
2.2e-06 |
21 |
| gtgagt |
6.0e-06 |
14 |
| aggttt |
6.6e-06 |
12 |
| taagtt |
6.6e-06 |
12 |
| tagtat |
8.8e-06 |
6 |
|
| 6-mmer |
e-value |
# |
| tttaaa |
1.8e-12 |
34 |
| aatttt |
2.2e-10 |
61 |
| atttta |
2.9e-09 |
39 |
| cagcag |
1.2e-08 |
30 |
| taattt |
8.3e-08 |
30 |
| ttcccc |
2.1e-07 |
10 |
| tttttt |
5.2e-07 |
55 |
| atatat |
7.8e-07 |
18 |
| atttaa |
1.3e-06 |
21 |
| taaaaa |
1.5e-06 |
31 |
| gctagc |
5.1e-06 |
5 |
| aggcgg |
5.9e-06 |
11 |
|
| 6-mmer |
e-value |
# |
| tgtgtg |
5.9e-31 |
49 |
| ttgtgt |
1.7e-24 |
60 |
| gtgtgt |
3.6e-16 |
34 |
| gttgtg |
4.4e-15 |
31 |
| tgttgt |
3.3e-14 |
37 |
| tgcatg |
1.3e-13 |
22 |
| gcatgt |
7.1e-12 |
22 |
| tccttt |
1.1e-11 |
31 |
| tgtgtt |
2.9e-11 |
42 |
| gtgttt |
2.2e-10 |
40 |
| ttttgt |
7.2e-10 |
91 |
| tgtggt |
1.9e-09 |
18 |
|
|
- length penalties (ExonSkiper & ExonInIntron)
- all Penalties for ExonInIntron
|
|
|
$Id: index.html,v 1.18 2005/05/20 12:52:10 cvs24 Exp
$
|
