Transcript Normalization and Segmentation of Tiling Array Data
Abstract
For the analysis of transcriptional tiling arrays we have developed two methods based on state-of-the-art machine learning algorithms. First, we present a novel transcript normalization technique to alleviate the effect of oligonucleotide probe sequences on hybridization intensity. It is specifically designed to decrease the variability observed for individual probes complementary to the same transcript. Applying this normalization technique to Arabidopsis tiling arrays, we are able to reduce sequence biases and also significantly improve separation in signal intensity between exonic and intronic/intergenic probes. Our second contribution is a method for transcript mapping. It extends an algorithm proposed for yeast tiling arrays to the more challenging task of spliced transcript identification. When evaluated on raw versus normalized intensities our method achieves highest prediction accuracy when segmentation is performed on transcript-normalized tiling array data.
To cite the transcript normalization or segmentation method please refer to
Zeller G., Henz S.R., Laubinger S., Weigel D., and Rätsch G. (2008) Transcript Normalization and Segmentation of Tiling Array Data, Pacific Symposium on Biocomputing 13:527-538.
Correcting for probe sequence effects
For all types of DNA oligonucleotide microarrays strong effects of probe sequences on hybridization intensity have been observed (e.g. [1], [2]). To reduce within-gene variability of transcriptome whole-genome tiling array measurements we have developed a novel transcript normalization technique. Assuming that hybridization intensity should ideally be constant across all probes interrogating the same transcript, we related the deviations between observed intensities and ideal transcript intensities to the sequences of oligonucleotide probes (see Figure 1 for an illustration).

Figure 1. Illustration of the transcript normalization procedure. Shown is the 3' end of a transcript with hybridization intensities, transcript intensities and the deviation between both (see inset).
We modeled probe sequences as 0/1 vectors that indicate position-specific occurrences of mono-, di- and trimer substrings and perform linear regression (Ridge regression) to predict the deviation from median transcript intensities. After correcting with these estimates, the variation of individual probes from constant transcript intensities decreased to approximately one half and sequence effects such as GC bias were indeed reduced to an extent that is comparable to other methods [2] (Figure 2). In contrast to the aproach by Royce and colleagues [2] transcript normalization resulted in improved separation between intensities of exonic probes on the one hand and intronic and intergenic probes on the other hand (Figure 3) especially for genes with low to moderate expression levels (Figure 4).
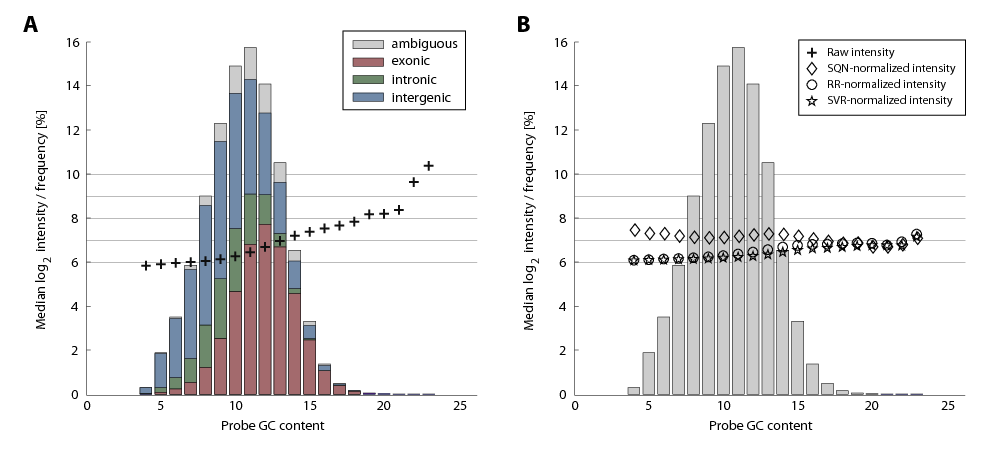
Figure 2. Median hybridization intensity depends on GC content of oligonucleotide probes. The histogram obtained by partitioning probes according to their GC content is shown as bar plots. In each bin the frequency of exonic, intronic and intergenic probes are color-coded (see inset), and the median log-intensity is shown before (A) and after (B) the application of normalization methods (see inset).
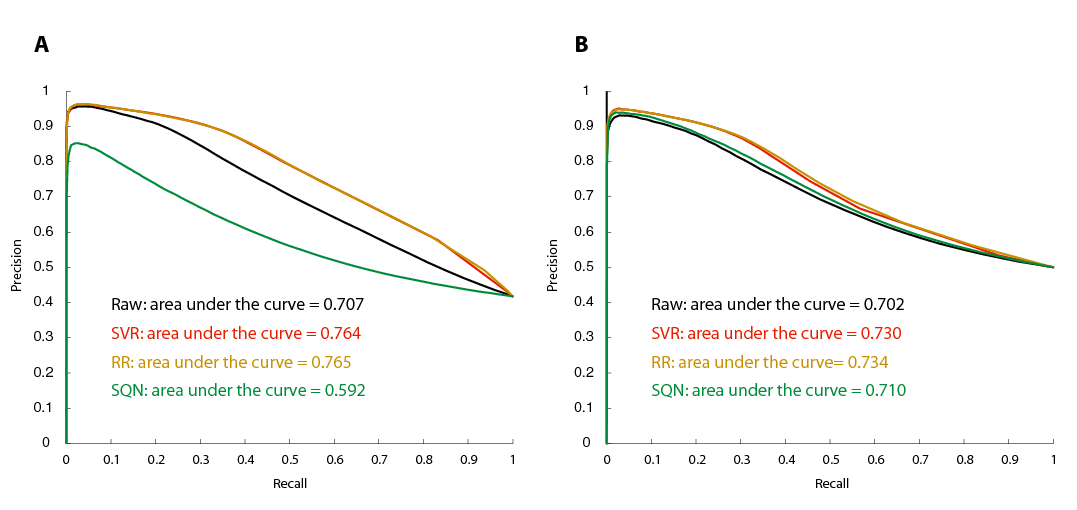
Figure 3. Separation in intensity between probes mapped to known exons and probes in regions annotated as untranscribed or intronic improved after transcript normalization. (A) By varying the cutoff value, we calculated the precision-recall curve from all probes in the test regions. (B) Prior to thresholding and precision-recall estimation, probes were sub-sampled to obtain the same GC-content among exonic and intergenic/intronic probes.
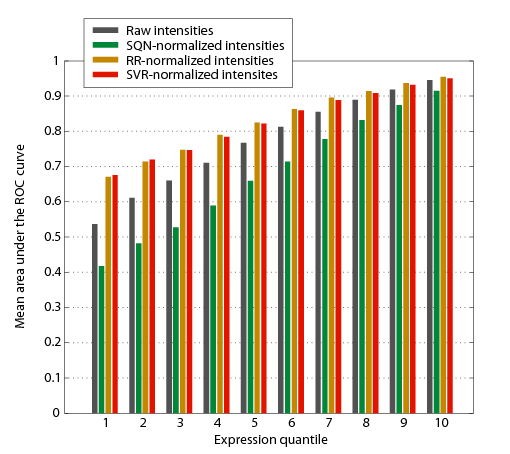
Figure 4. Separation in intensity between intron and exon probes broken down by expression quantiles and normalization methods. Expression values were calculated based on the median intensity of probes annotated as exonic. For each gene the area under the ROC curve (auROC) was obtained by local thresholding and for each expression quantile, auROC values were averaged over all genes in that quantile.
Segmentation of transcriptome tiling microarray data
The confirmation of annotated genes as well as the detection of novel transcripts requires a segmentation of transcriptome tiling array measurements into exonic and intronic or untranscribed regions. We approached this task with an HM-SVM based method called mSTAD (margin-based segmentation of tiling array data) that conceptually extends a recently published transcript mapping algorithm applied to yeast tiling array data [4]. HM-SVMs [3] combine the benefits of Hidden Markov Models by introducing a state model that defines allowed segmentations (Figure 5) with those of large-margin classifiers such as Support Vector Machines.
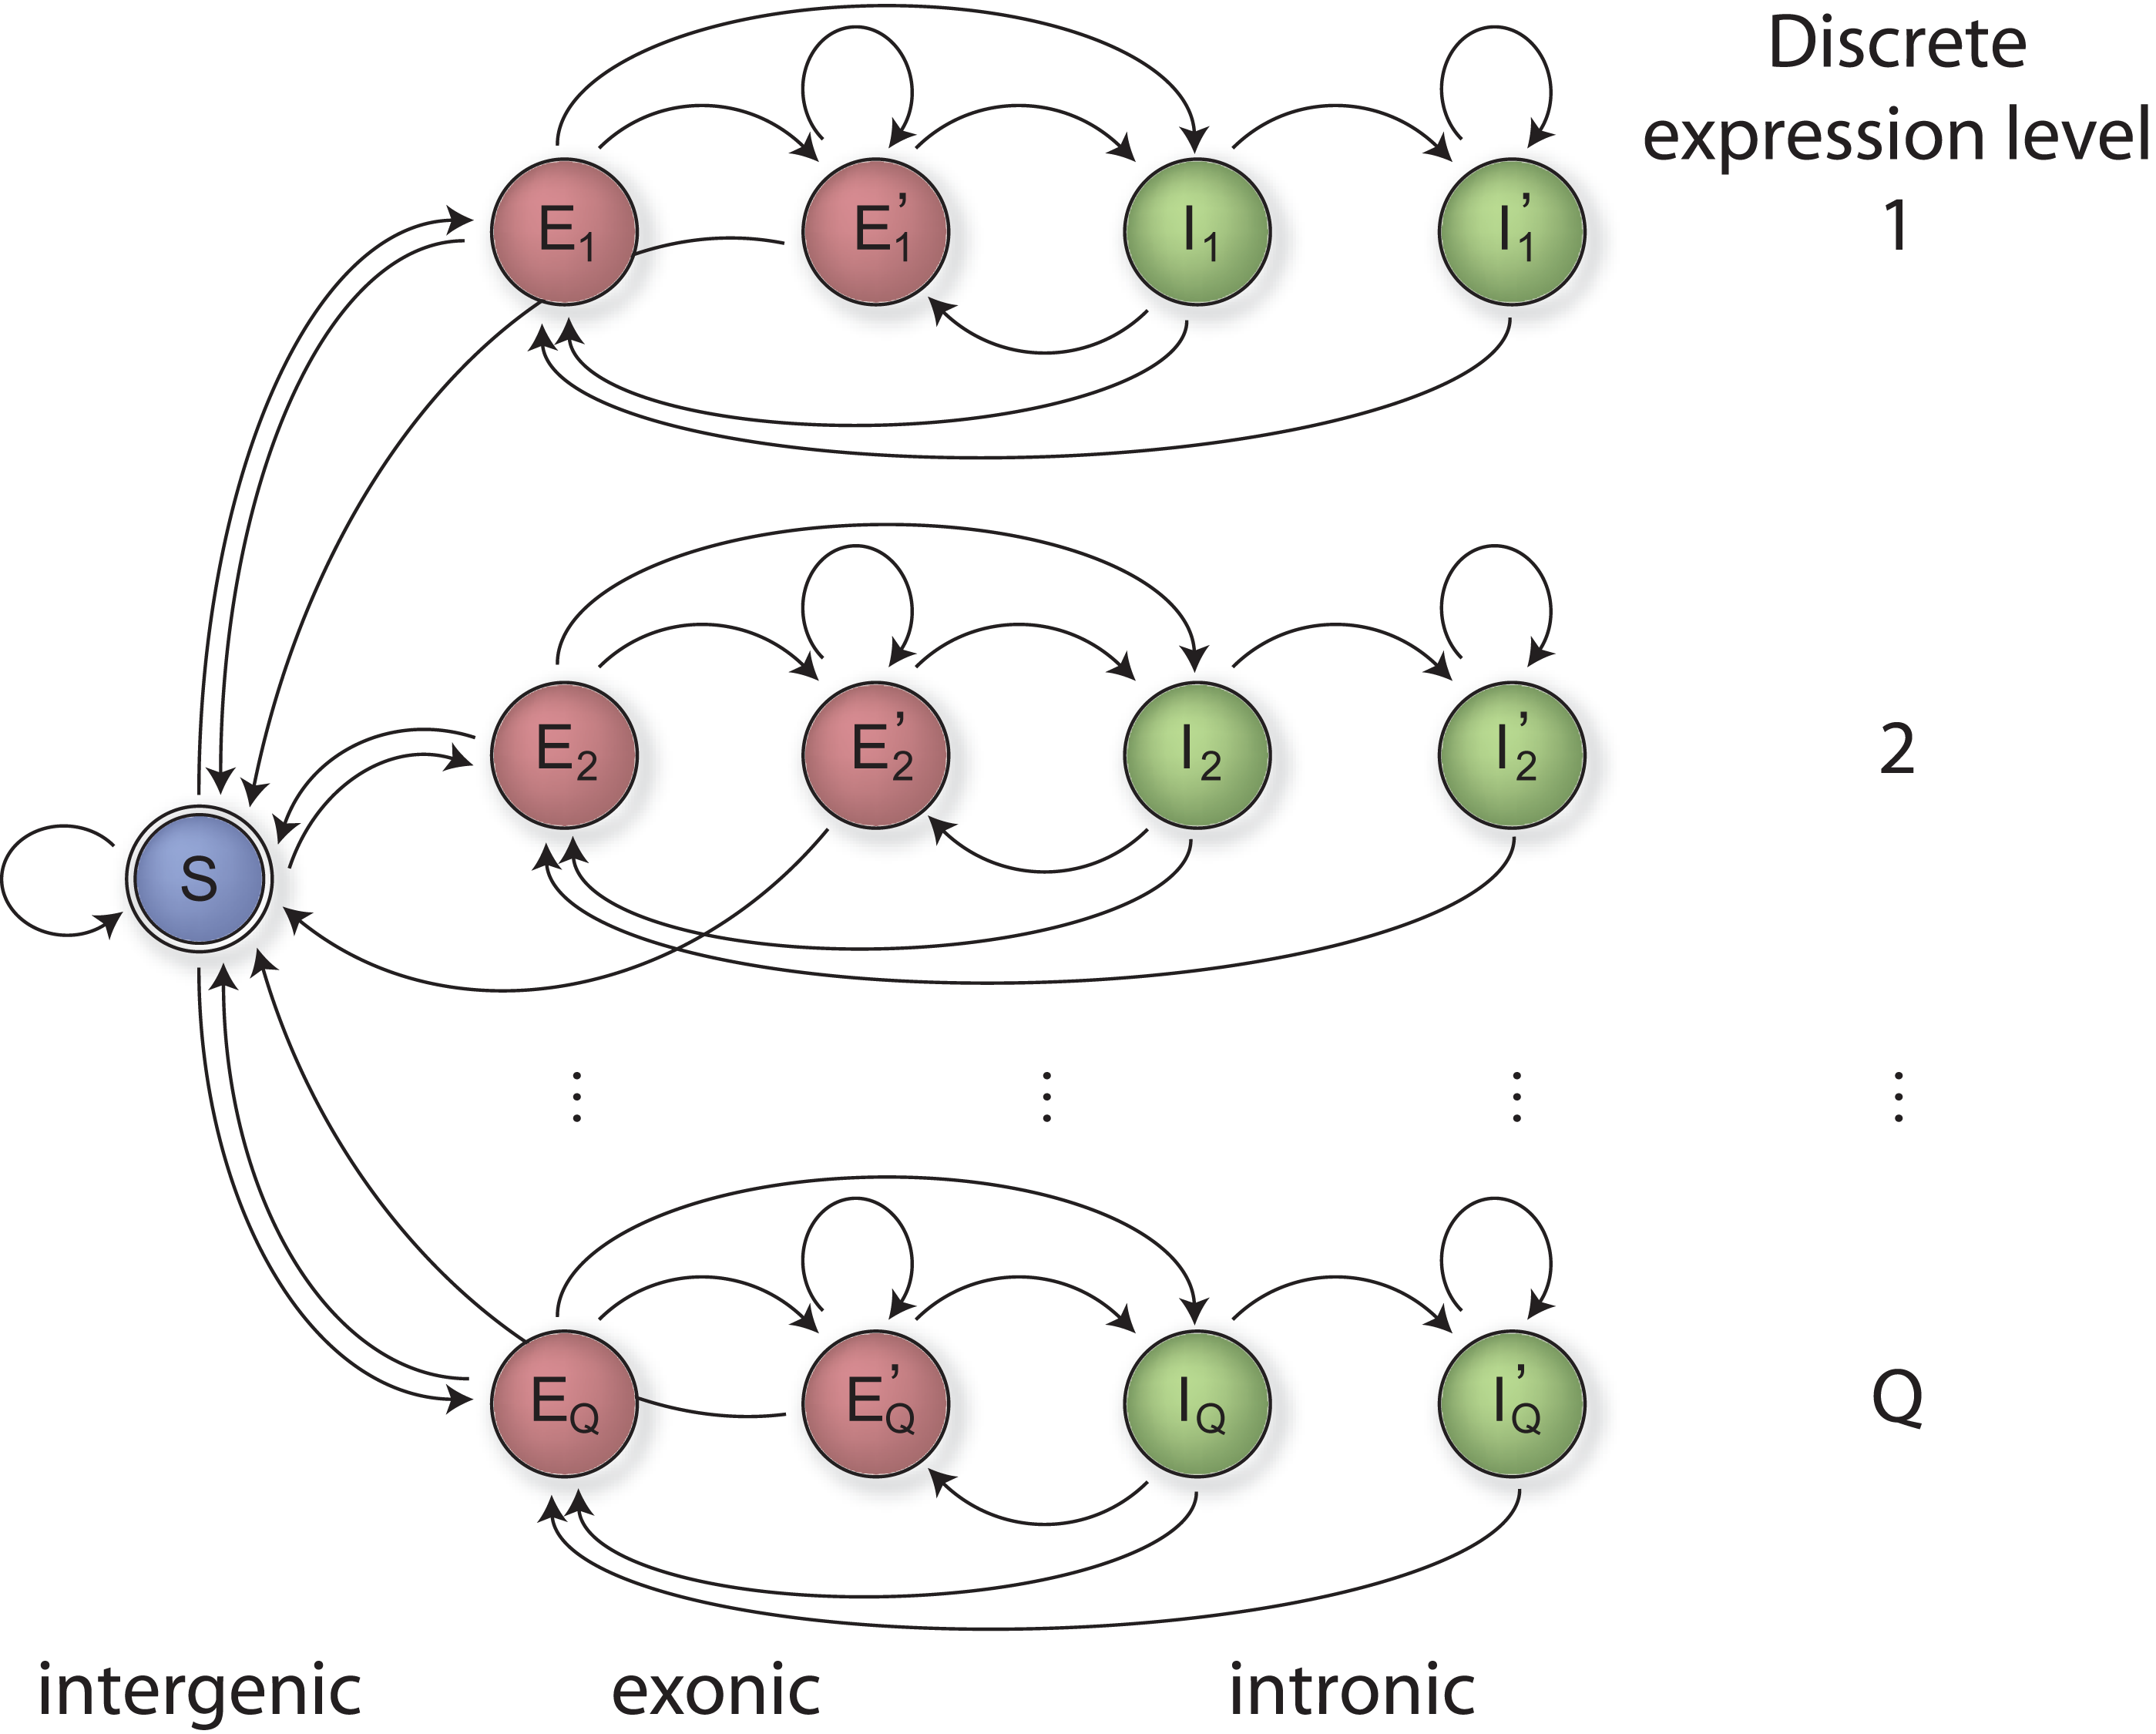
Figure 5. State model with a subset of states for each expression quantile (rows). The label corresponding to each state is indicated at the bottom.
MSTAD identified exonic probes more accurately than naive thresholding techniques or the widely used transfrag method [5] implemented in the Affymetrix tiling array software (Figure 6).
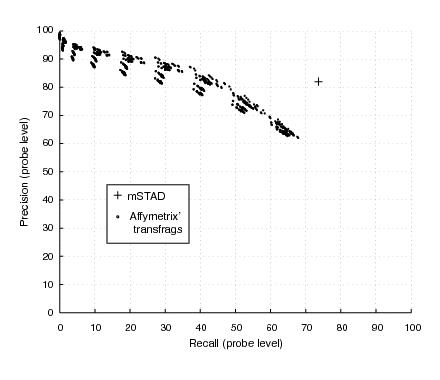
Figure 6. Accuracy of exon probe recognition assessed on annotated genes. The transfrag method was evaluated for 900 different parameter sets to obtain various trade-offs between precision and recall.
Resources
The paper is avaliable for download here or at the PSB website. An appendix containing additional material is also available.
If you are interested in finding out how your favorite Arabidopsis gene can be detected in a tiling array atlas of transcription surveying several tissues and developmental stages [6], have a look at the At-TAX Genome Browser.
The transcript-normalization and the mSTAD segmentation method are free software. Source code and supplementary data can be downloaded from our FTP server.
The segmentation code is based on our generic Hidden Markov SVM toolbox which is also freely available from the FTP server.
So far, interfaces to CPLEX and Mosek are provided (the latter offers free trials and 3-month student licenses). Further interfaces to freely available solvers are planned.
Please contact either Georg Zeller, Pramod Mudrakarta, or Gunnar Rätsch if you have questions about the software.
References
| [1] | Naef and Magnasco. Solving the riddle of the bright mismatches: the physics of hybridization. Phys. Rev. E 68, 011906, 2003. |
| [2] | (1, 2, 3) Royce, Rozowsky and Gerstein. Assessing the need for sequence-based normalization in tiling microarray experiments. Bioinf., 23(8):988-997, 2007. |
| [3] | Tsochantaridis, Joachims, Hofmann and Altun. Large margin methods for structured and interdependent output variables. J. Mach. Learn. Res., 6:1453-1484, 2005. |
| [4] | Huber, Toedling and Steinmetz. Transcript mapping with high-density oligonucleotide tiling arrays. Bioinf. 22(6):1963-1970, 2006. |
| [5] | Kampa, Cheng, Kapranov, Yamanaka, Brubaker, et al.. Novel RNAs identified from an in-depth analysis of the transcriptome of human chromosomes 21 and 22. Genome Res. 14(3):331-342, 2004. |
| [6] | Laubinger, Zeller, Henz Sachsenberg, Widmer, et al.. At-TAX: a whole genome tiling array resource for developmental expression analysis and transcript identification in Arabidopsis thaliana. Genome Biol. 9:R112, 2008. |