Abstract
We study the problem of domain transfer for a supervised classification task in
mRNA splicing. We consider a number of recent domain transfer methods from
machine learning, including some that are novel, and evaluate them on genomic
sequence data from model organisms of varying evolutionary distance. We find
that in cases where the organisms are not closely related, the use of domain adaptation
methods can help improve classification performance.
The paper is available, (
here).
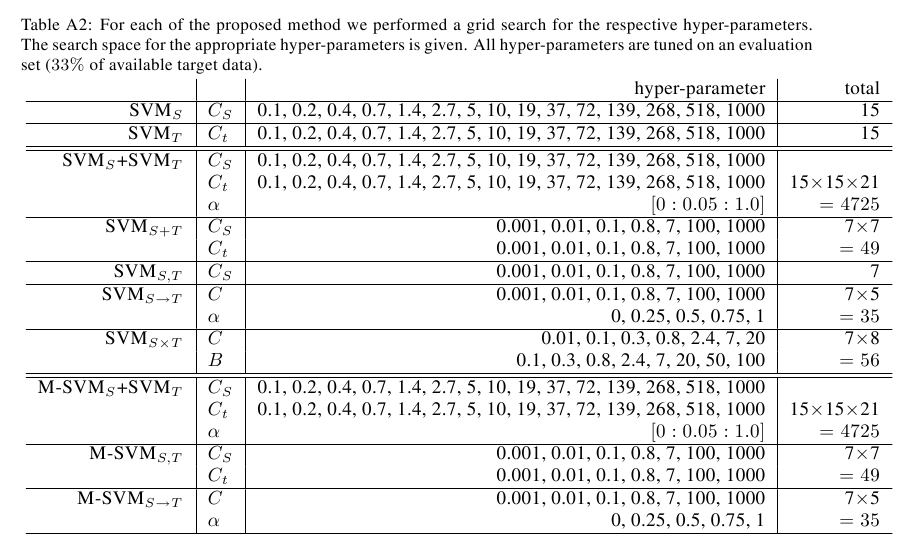
The data splits, additional information on model selection, the predictions as well as the stand-alone prediction tool are available on request. If there are questions, please contact Gunnar.Raetsch@tuebingen.mpg.de.
Results
Graphical Results
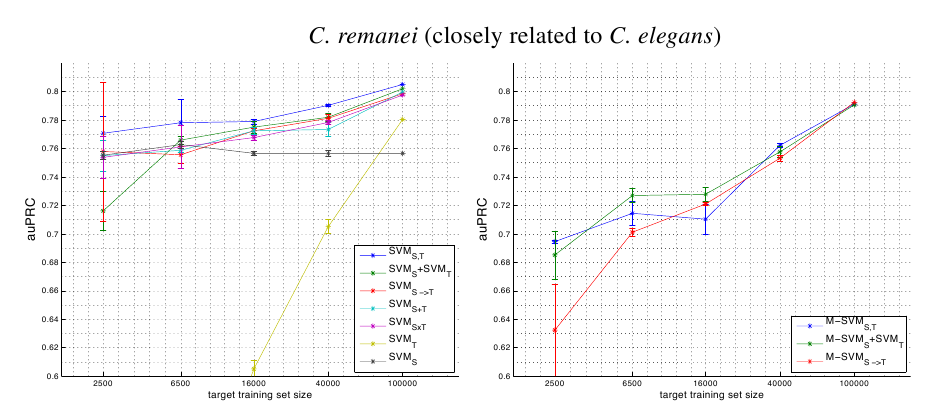
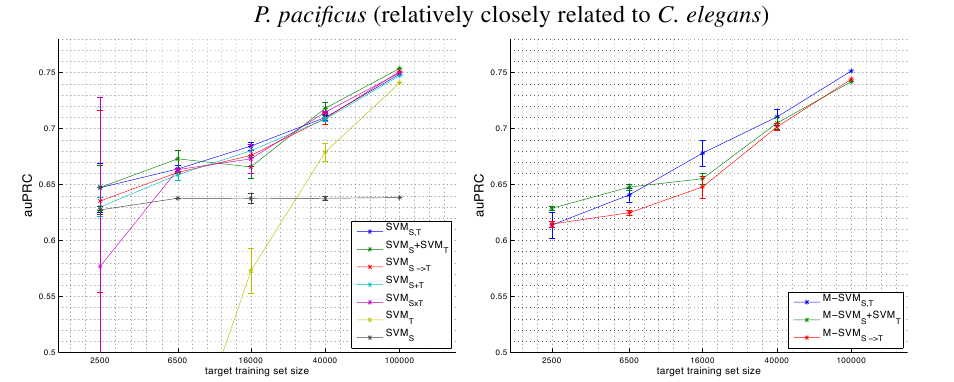
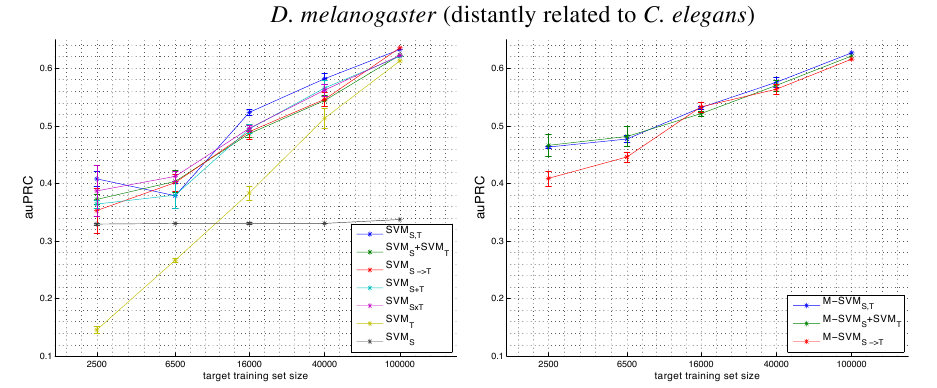
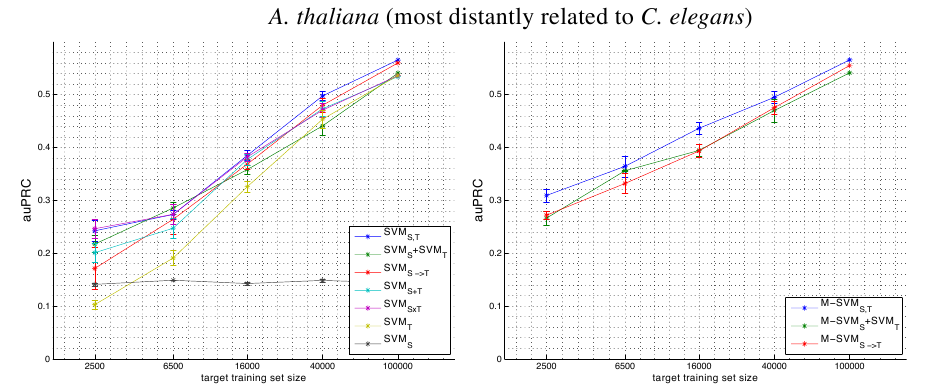
Tabular Single Source Results
|
2500 |
6500 |
16000 |
40000 |
100000 |
| SVMS,T |
77.06 (±2.13) |
77.80 (±2.89) |
77.89 (±0.29) |
79.02 (±0.09) |
80.49 (±0.0) |
| SVMS+SVMT |
71.61 (±2.39) | 76.58 (±0.52) | 77.50 (±0.77) | 78.19 (±0.44) | 80.19 (±0.0) |
| SVMSxT |
75.37 (±2.56) | 76.10 (±2.62) | 76.76 (±0.28) | 77.82 (±0.23) | 79.75 (±0.0) |
| SVMS->T |
75.78 (±8.43) | 75.55 (±1.08) | 77.23 (±0.37) | 78.11 (±0.49) | 79.84 (±0.0) |
| SVMS+T |
75.49 (±1.88) | 75.87 (±0.25) | 77.23 (±0.47) | 77.33 (±0.83) | 79.96 (±0.0) |
| SVMS |
75.52 (±0.44) | 76.27 (±0.42) | 75.65 (±0.23) | 75.65 (±0.4) | 75.65 (±0.0) |
| SVMT |
24.04 (±4.53) | 46.45 (±2.29) | 60.51 (±1.01) | 70.50 (±0.85) | 78.04 (±0.0) |
C.remanei
|
2500 |
6500 |
16000 |
40000 |
100000 |
| SVMS,T |
64.72 (±3.75) | 66.39 (±0.66) |
68.44 (±0.67) | 71.00 (±0.38) | 74.88 (±0.0) |
| SVMS+SVMT |
64.74 (±3.49) |
67.30 (±1.38) | 66.58 (±1.82) |
71.82 (±0.97) |
75.39 (±0.0) |
| SVMSxT |
57.67 (±26.14) | 66.33 (±0.28) | 67.29 (±2.24) | 71.46 (±0.21) | 74.99 (±0.0) |
| SVMS->T |
63.52 (±14.05) | 66.07 (±0.07) | 67.59 (±1.7) | 70.90 (±0.95) | 75.11 (±0.0) |
| SVMS+T |
62.99 (±1.48) | 65.87 (±0.83) | 68.02 (±0.97) | 70.85 (±0.37) | 74.73 (±0.0) |
| SVMS |
62.73 (±0.62) | 63.77 (±0.04) | 63.75 (±0.75) | 63.77 (±0.36) | 63.83 (±0.0) |
| SVMT |
20.36 (±3.94) | 38.16 (±3.21) | 57.28 (±3.46) | 67.90 (±1.35) | 74.10 (±0.0) |
P.pacificus
|
2500 |
6500 |
16000 |
40000 |
100000 |
| SVMS,T |
40.80 (±2.18) | 37.87 (±3.77) |
52.33 (±0.91) |
58.17 (±1.5) | 63.26 (±0.0) |
| SVMS+SVMT |
37.23 (±1.58) | 40.36 (±3.32) | 48.64 (±0.99) | 54.38 (±1.57) | 62.26 (±0.0) |
| SVMSxT |
38.71 (±7.67) |
41.23 (±1.4) | 49.58 (±0.91) | 56.20 (±1.86) | 62.22 (±0.0) |
| SVMS->T |
35.29 (±6.72) | 40.15 (±2.47) | 48.98 (±2.19) | 54.60 (±1.99) |
63.53 (±0.0) |
| SVMS+T |
36.43 (±1.18) | 37.98 (±4.05) | 49.46 (±1.38) | 56.56 (±2.36) | 62.07 (±0.0) |
| SVMS |
32.95 (±0.38) | 33.05 (±0.07) | 33.07 (±0.25) | 33.07 (±0.01) | 33.74 (±0.0) |
| SVMT |
14.59 (±1.02) | 26.69 (±0.58) | 38.33 (±2.06) | 51.32 (±2.86) | 61.26 (±0.0) |
D.melanogaster
|
2500 |
6500 |
16000 |
40000 |
100000 |
| SVMS,T |
24.21 (±3.41) | 27.30 (±1.46) |
38.49 (±1.59) |
49.75 (±1.46) |
56.54 (±0.0) |
| SVMS+SVMT |
21.70 (±2.77) |
28.55 (±1.96) | 35.80 (±1.48) | 44.07 (±2.99) | 54.06 (±0.0) |
| SVMSxT |
24.62 (±3.07) | 27.33 (±3.17) | 38.20 (±1.32) | 47.05 (±2.39) | 53.60 (±0.0) |
| SVMS->T |
17.09 (±6.79) | 26.41 (±4.81) | 36.83 (±1.74) | 47.98 (±2.25) | 55.99 (±0.0) |
| SVMS+T |
20.06 (±3.23) | 24.71 (±3.25) | 37.72 (±1.74) | 47.31 (±2.55) | 53.41 (±0.0) |
| SVMS |
14.07 (±0.46) | 14.85 (±0.1) | 14.23 (±0.53) | 14.83 (±0.49) | 14.33 (±0.0) |
| SVMT |
10.23 (±1.56) | 19.07 (±2.53) | 32.56 (±1.91) | 45.34 (±2.83) | 53.63 (±0.0) |
A.thaliana
Tabular Multi Source Results
|
2500 |
6500 |
16000 |
40000 |
100000 |
| M-SVMS,T |
69.45 (±0.17) | 71.44 (±1.5) | 71.03 (±1.8) |
76.21 (±0.2) | 79.11 (±0.0) |
| M-SVMS+SVMT |
68.51 (±2.95) |
72.69 (±0.86) |
72.78 (±0.8) | 75.75 (±0.64) | 79.06 (±0.0) |
| M-SVMS->T |
63.23 (±5.61) | 70.11 (±0.52) | 72.09 (±0.19) | 75.32 (±0.32) |
79.24 (±0.0) |
| SVMT |
24.04 (±4.53) | 46.45 (±2.29) | 60.51 (±1.01) | 70.50 (±0.85) | 78.04 (±0.0) |
C.remanei
|
2500 |
6500 |
16000 |
40000 |
100000 |
| M-SVMS,T |
61.38 (±2.05) | 64.07 (±1.07) |
67.81 (±2.0) |
71.05 (±1.26) |
75.15 (±0.0) |
| M-SVMS+SVMT |
62.88 (±0.3) |
64.77 (±0.52) | 65.52 (±0.81) | 70.50 (±0.94) | 74.20 (±0.0) |
| M-SVMS->T |
61.46 (±0.49) | 62.48 (±0.41) | 64.78 (±1.7) | 70.14 (±0.56) | 74.43 (±0.0) |
| SVMT |
20.36 (±3.94) | 38.16 (±3.21) | 57.28 (±3.46) | 67.90 (±1.35) | 74.10 (±0.0) |
P.pacificus
|
2500 |
6500 |
16000 |
40000 |
100000 |
| M-SVMS,T |
46.32 (±0.39) | 47.71 (±1.03) | 53.17 (±0.45) |
57.56 (±1.54) |
62.66 (±0.0) |
| M-SVMS+SVMT |
46.61 (±3.27) |
48.15 (±3.02) | 52.12 (±0.73) | 57.01 (±1.64) | 62.12 (±0.0) |
| M-SVMS->T |
40.89 (±2.28) | 44.61 (±1.51) |
53.29 (±1.47) | 56.35 (±1.57) | 61.57 (±0.0) |
| SVMT |
14.59 (±1.02) | 26.69 (±0.58) | 38.33 (±2.06) | 51.32 (±2.86) | 61.26 (±0.0) |
D.melanogaster
|
2500 |
6500 |
16000 |
40000 |
100000 |
| M-SVMS,T |
30.90 (±2.12) |
36.43 (±3.46) |
43.63 (±1.92) |
49.49 (±1.92) |
56.57 (±0.0) |
| M-SVMS+SVMT |
26.61 (±2.29) | 35.58 (±0.31) | 39.43 (±1.98) | 46.98 (±3.73) | 54.11 (±0.0) |
| M-SVMS->T |
27.17 (±1.33) | 33.18 (±3.32) | 39.32 (±2.07) | 47.53 (±2.2) | 55.50 (±0.0) |
| SVMT |
10.23 (±1.56) | 19.07 (±2.53) | 32.56 (±1.91) | 45.34 (±2.83) | 53.63 (±0.0) |
A.thaliana
Data
Download Dataset in MATLAB format
Model Selection
